Instagram analytics gives your business a competitive advantage. You can think of analytics, data about your account that is statistically organised. Statistically means you see simple bar graphs, and computed data about your account. Understanding these analytics helps you grow your account organically!
You can see several insights on your Instagram account. Clicking on the three horizontal lines on the right hand side of your profile, redirects you to the image below.
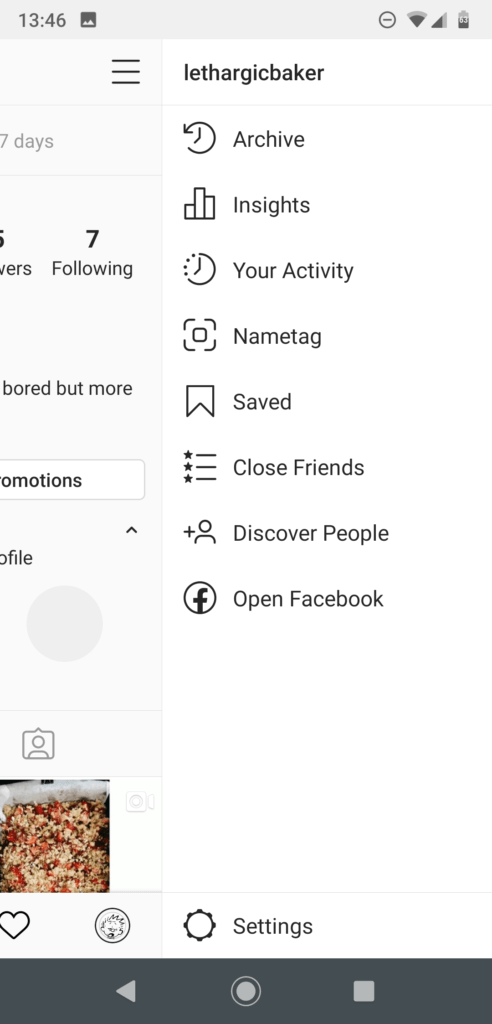
Now, you can click on “Insights” to see what posts have been doing well. These analytics allow you to analyse what type of content is the most popular one on your account.
When you click on “insights”, you see three different tabs. They are, content, activity and audience.
Instagram Content Analytics
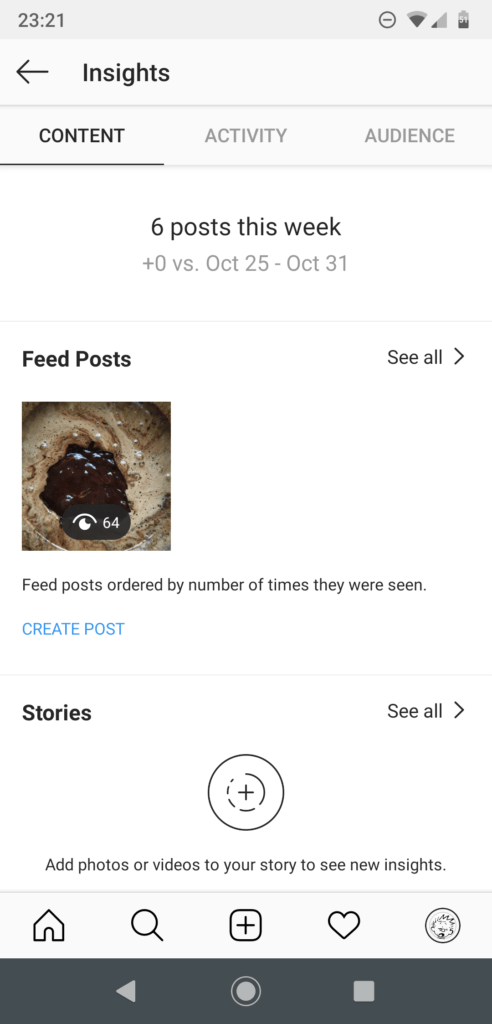
First, let’s see what the content tab has to offer! What stands out right at the top, is the number of posts you have posted in a week. For example, the image below shows, that 6 posts were uploaded this week.
This calculates even the number of stories you have put up! And if the posting has not been consistent, Instagram has no previous data to compare it to. But, for example, assume you have posted +3 posts more than last week. And you have received more traffic on your account, this indicates what type of content you should recreate.
Now, underneath that is the Feed Posts. Here, you get to see, how many times people have viewed your posts. Instagram sorts this depending on each post’s “reach”. It simply refers to the number of people who have seen the content you uploaded. To further dive deep into your reach, you simple tap on it. It is highlighted in blue, as shown in the image below.
Need best captions for Instagram? Check out our post on best Instagram Captions!
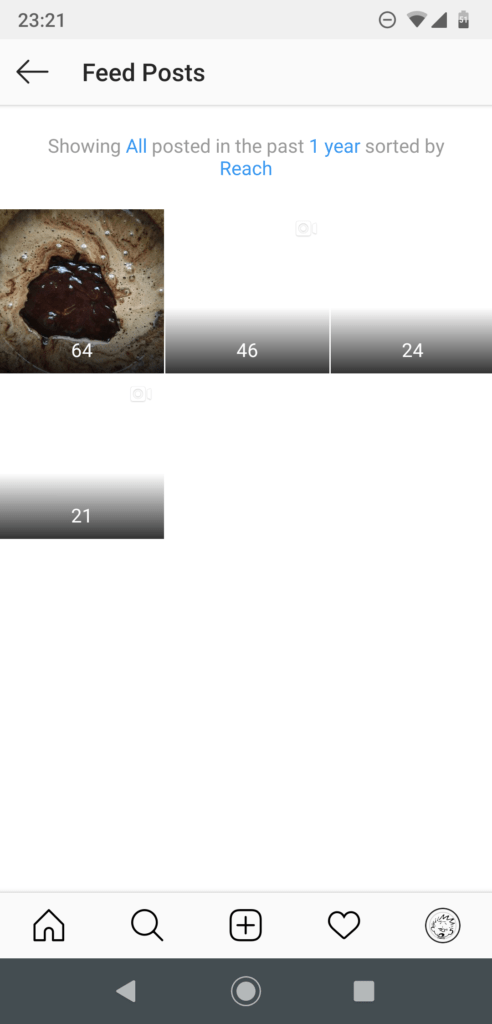
You can filter your content, depending on the number of likes, comments, follows, likes and much more. All of this can be done by tapping on the word “reach”. You can also filter and view your content as only the photos, or videos. Although, Instagram allows you to analyse your feed posts, only for what you have posted in the past two years.
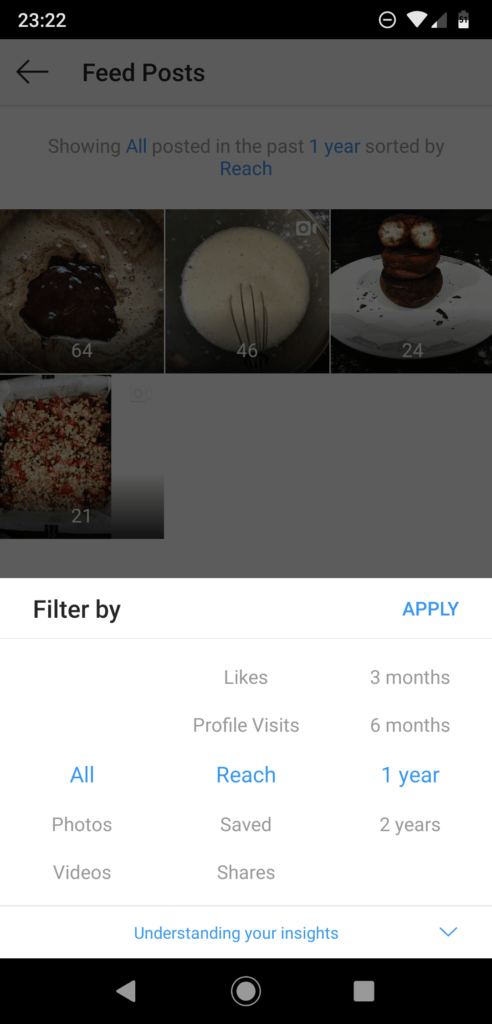
Now underneath the feed posts, you see “Stories.” You can see all the stories you have uploaded in the past, by tapping on “see all” on the right hand side. Once you click on “reach”, you see “understanding your insights.”
Instagram breaks down each filter category for you. Stories that encourage engagement between the followers and you, do well. Polls, Q&A’s encourage people to respond. You get to know your Instagram followers better this way!
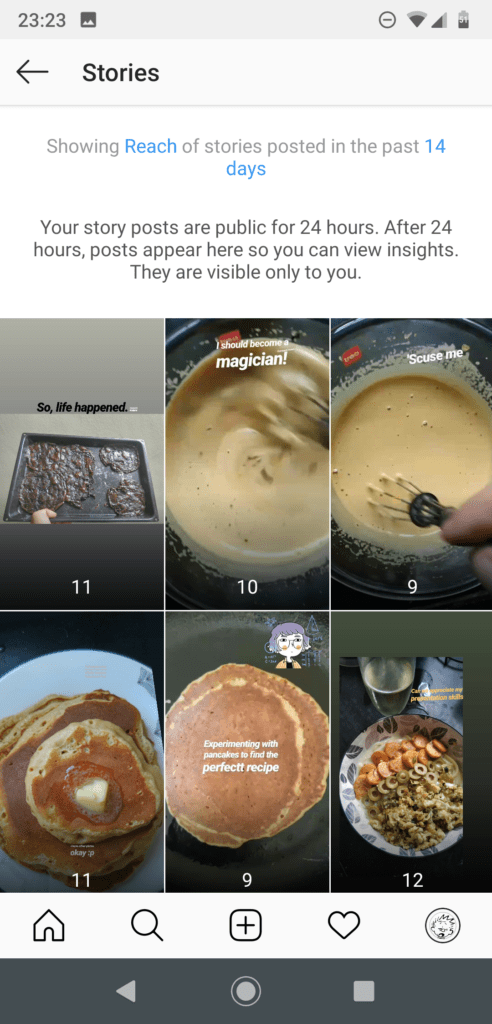
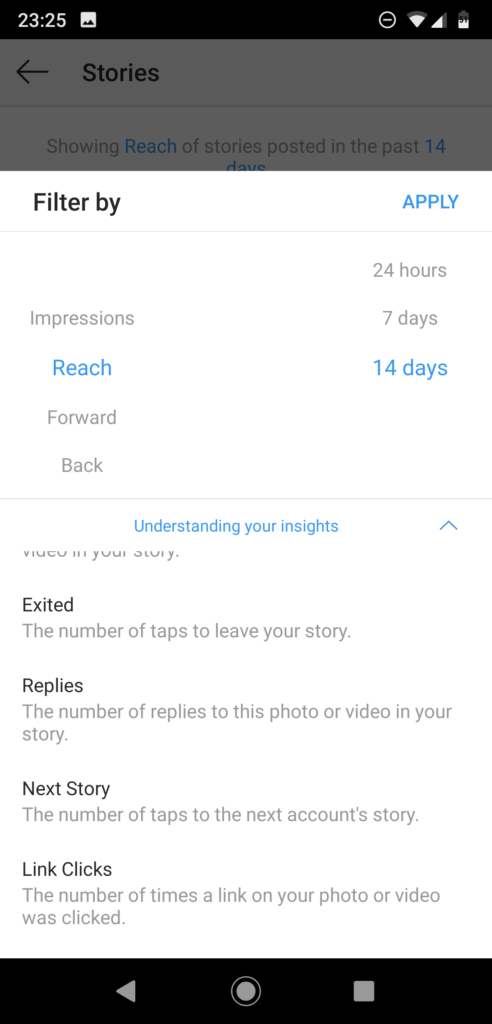
Underneath that you have the Promotions Tab. Instagram curates similar insights for the content you set up for promotions. The promotional insights however, are only available for business accounts to view.
Instagram Insights- What Instagram Analytics are available?
Instagram Analytic- ACTIVITY
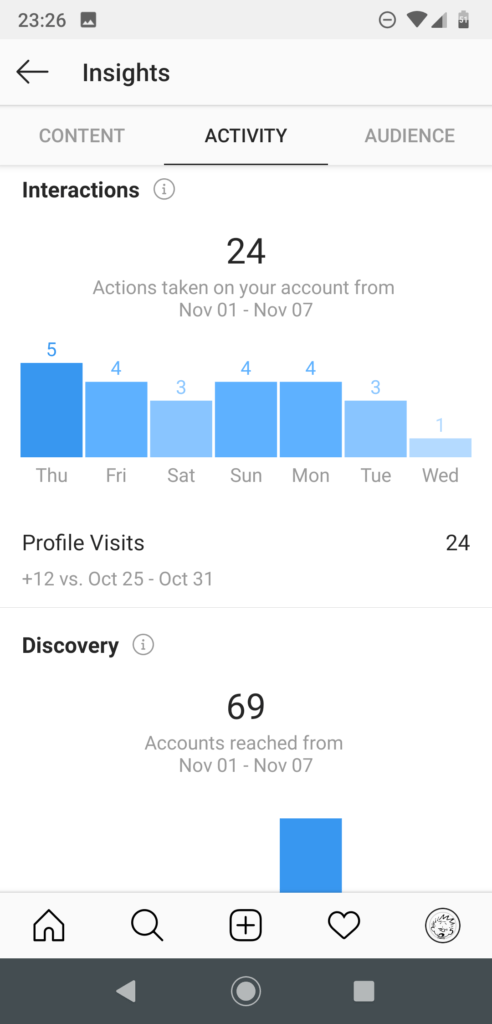
Right next to Content, you can see the Activity tab. The intial thing that you see, is Interactions. Now interactions according to Instagram refers to the actions people have taken with your account. This can include the comments, likes you have received on your post.
Followers, and saving your posts also come under this tab. When you click on the bar graph, you can to see how many interactions have taken place on each day of the week.
Instagram Profile Visits:
Right below Interactions, you see profile visits. This is the number of people who have visited your account and seen your feed. You can see in the image below, that the profile visits were +12 more than last week. Again, Instagram sorts out these profile visits from week to week.
Instagram Analytics – What does Discovery Mean?
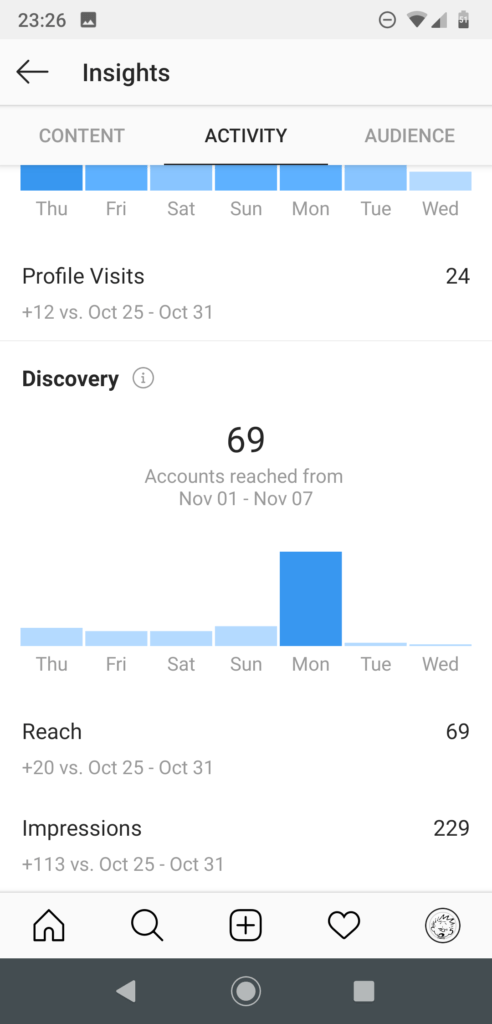
Below Profile visits, there is Discovery tab. The analytics give you a graphical representation of the number of accounts your post has reached. The discovery could be for a variety of reasons.
It can range from a promotion you just did, to a whole new set of hashtags you used in your post. The bar graph gives you a weekly update of how discoverable your account has been.
Instagram Reach Analytics:
Underneath discovery, you see reach. This is an estimate by Instagram’s AI as to how many unique accounts have seen your post. A 7 day breakdown of your reach is visually represented. The overall number of accounts reached may not be accurate. This is because, few accounts may revisit your account and see your feed. That’s why Instagram analytics calculates only the number of different and new accounts that have seen your posts.
What is Instagram’s Impressions Analytic?
At the end of your screen, you see Impressions. Instagram impressions are the total number of times overall you feed and its contents have been seen. The people who have seen this content, include people outside your followers as well.
Instagram Analytic: Audience
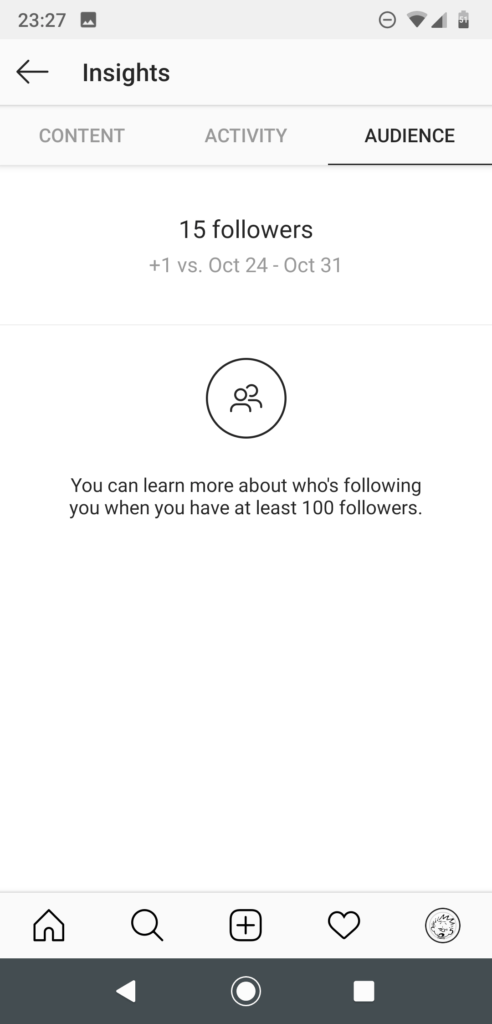
To fully comprehend Instagram Analytics, the last tab is crucial to analyse. It includes your Audience. This insights tab gives you intel on your audience. Although, you can see this once you have more than 100 followers. If you have more than 100 followers, the first thing you will see, is the number of followers you have.
Beneath that, is a Growth tab. The Growth tab gives you insight about the number of people who have unfollowed you and new individuals who have followed you. The overall growth is basically the difference between those who have followed you and those who unfollowed you. Instagram gives you a graphical representation of your overall growth for the past week.
Under the graph, you have Top Locations tab. You can sort out your audience based on the countries they are from, or their cities. Instagram breaks them down for you. Cities are more fruitful for local businesses wanting to advertise their products.
Instagram Followers Analytics
Instagram Analytics also shows you the age range of your followers. The age range is an important indicator to understand the type of content that resonates with your audience. Opinions vary across generations. Also, You have the option to categorise them depending on the gender.
The last category under Audience, is the Followers. A bar graph helps you understand, at what time of the day your followers are most active. Instagram insights also shows you the days your followers are active on. These follower insights can help you decide on your posting schedule. Analysing the time and day of the week, and posting at their most active hours can drive in more traffic for your posts.
Finally, it is important to remember that all of the above technical terms and their constant fluctuation mainly depends on the content you post. In the world of Instagram creators and businesses, more is always better!
